


We live in a world with ever-expanding volumes of data, data types, and use cases for how data can become actionable. With each generation of datasets, a corresponding set of tools are made available but often aren’t put together holistically to the entirety of how data should be understood.
Any experienced marketer can identify the difference between a toolset created for the sake of tool creation and a product that is engineered holistically to empower the marketer. At Kochava, we talk a lot about how we build our platform with “interlocking” capabilities. This means that as new data sets are available—or new needs arise from our customers—we don’t simply attach a new toolset on top of the system only to find a Frankenstein created over time. Instead, we talk about how our platform exposes interlocking capabilities so that various features across the platform take advantage and leverage the data available. This is what enables Kochava to deliver an unfair advantage for our customers.
Designing a product that creates this unfair advantage means we are solving real world problems—not only in concept. For us, this is not just a goal but an evolving reality. What many of our customers don’t know is that when we’re brought in to help understand performance, deep-dive into data, help unpack potential fraud indicators, or even identify under- (or over-) performing segments, we use the same tools internally to analyze data that we provide directly to our customers, and they’re pretty great!
When you have true row-level data at your disposal, not only is there complete transparency in all your system decisions, but you can quickly innovate other products and offerings on top of that dataset.
Let’s unpack three essential questions you should ask about your data and what the answers should tell you about your measurement platform. Along the way, I’ll spell out some of the nerdy things you can do with your data inside the Kochava platform.
How fast can I access my data?
When I was younger, I spent a fair share of time playing the original “Age of Empires.” It’s a great example of engaging multiplayers on rudimentary networking frameworks. At the time, partially because a certain 12-year-old couldn’t afford much of a PC, and partially because that same 12-year-old had setup his home network, he had less than ideal latency while playing on it. This meant that I would move a swath of archers or build reinforcements to defend a nearby castle, only to realize once the multiplayer engine caught up, that the enemy had flanked around the river and was now burning down a defenseless resource village.
We ask our customers to make sure we receive a real-time feed of their data, enabling us to make split-second decisions and empowering them to do the same through our products. This gives you the edge to make decisions each second, minute, or hour, instead of day or week. Programmatic or not, having a delayed picture of the world is not only blinding but infuriating.
Receiving real-time data in this manner is crucial for fighting fraud, which is becoming increasingly important. Keeping row-level data allows us to identify that n-factor that may be a significant fraud indicator but isn’t kept around if we were to only aggregate that data. For instance, we have run fraud audits for non-customers utilizing other measurement providers. When we perform these audits, we identify which parameters, keys, header values, etc., when scored, pinpoint potential fraud indicators. If that data is not provided to us at row-level, we only have what the measurement provider deemed “useful” at the time of ingestion. The result is that the world looks nice and fluffy because they aren’t keeping the correct metrics. Or, it looks deceivingly like there’s action being taken against fraudulent traffic because that provider only keeps the metrics that “can” be used by an inferior fraud detection tool.
To say that “real time” is a buzzword is probably an understatement. But not having true real-time data results in making delayed or blind decisions when attempting to capture an audience with an ever-decreasing attention span and results in false perceptions about acquired or reached users.
The working relationship of real time in conjunction with row-level data makes itself known in some of our real-time fraud abatement tools. Take Traffic Verification, a system that in real time validates that any click or impression meets a set of marketer-defined criteria. The criteria may include validation against a hot cache (a.k.a Global Fraud Blocklist) of known site IDs, IP addresses, and device IDs. The Blocklist is comprised of our curated list of bad actors added manually, programmatically (yes, an API is available), or flagged via the Fraud Console. Like all of our real-time decisions, we’re adding to the common Kochava object the results and decision flags around anything that passes or fails verification.
Further, once we’ve made any decision, a series of elements are added to each transaction to denote exactly what action was taken on that traffic. Remember I said that building in this fashion allows us to properly interlock capabilities? As soon as we added this feature to the platform, our customers could write Kochava queries to alert them on any number of Traffic Verification states or indicators. What does this look like? Send me a text when a new site ID has a 50% increase in fraud detected in one hour. Or, send me a Slack if a tracker has over 10% of its traffic fail verification in 24 hours. That’s the power of building on true row-level (and real-time) data.
How much of my data is available to access?
The short answer? All of it. To make our data immediately available to customers or internal downstream services in new and developing ways, we’ve created a common structure among our ingestion services. This allows all our customers to plug directly into our core processing engine as though they had internal access to our processing pipelines. It means that our ingestion service can accept a native Kochava object that represents a real-time transaction processing through our system. It takes transparency to an entirely new level.
This value is demonstrated as we introduce percent-weighted waterfalls for impression tracking of viewed videos. This configurable setting allows you to weight impressions, not just by the last impression but also across the waterfall based on the percentage of video completed. This inter-waterfall weighting model is new to Kochava but will be immediately available to any of our consuming services, and even our customers subscribing to our common object via our postback engine. What’s beautiful about this is that because we also adhere to this common module within our attribution modules, we’ve automatically leveled the landscape among SAN and Kochava network partners.
{
“attribution_influence”: “priority_imp_progress”,
“video_progress”: 0.7
}
We’ve also innovated methods to present our customers with a familiar way to access their data in an ad-hoc fashion. One of our most recent forays into this arena resulted in the BI tool, Kochava Query. It’s a full SQL engine that allows access directly into every single (yes, no joke) transaction we process on behalf of customers within seconds of being received. This means you can custom-query your clicks, impressions, sessions and purchases from this massive processing warehouse. Like anything else we build, this isn’t a fragile service. Have billions of impressions per day? Select “from impressions.” Do it. I dare you!
Is my data really row level? And, what is “log level”?
Row-level data is key not only to a continuous conversion of transparency but also for any critical question that has to be answered or need that must to fulfilled at a moment’s notice. You’ll never see an attribution decision or picture of the world presented in aggregate that isn’t represented with row-level data underneath. We make no claim to have a visionary understanding of each customer’s goals, unique funnel characteristics or future needs based on data we’re processing. This is why it’s so important to maintain row-level data. You can pivot data for any question.
And then there’s log-level data.
This one makes me chuckle. I hear “We keep log-level data.” The part you don’t hear is, “No, you can’t access it on your own, and yes, it will take us a while to retrieve/parse/present it to you.” There’s a big difference between log-level and row-level. Let’s take a look at some log-level data (we keep both). This was pulled directly from one of our NGINX proxies.
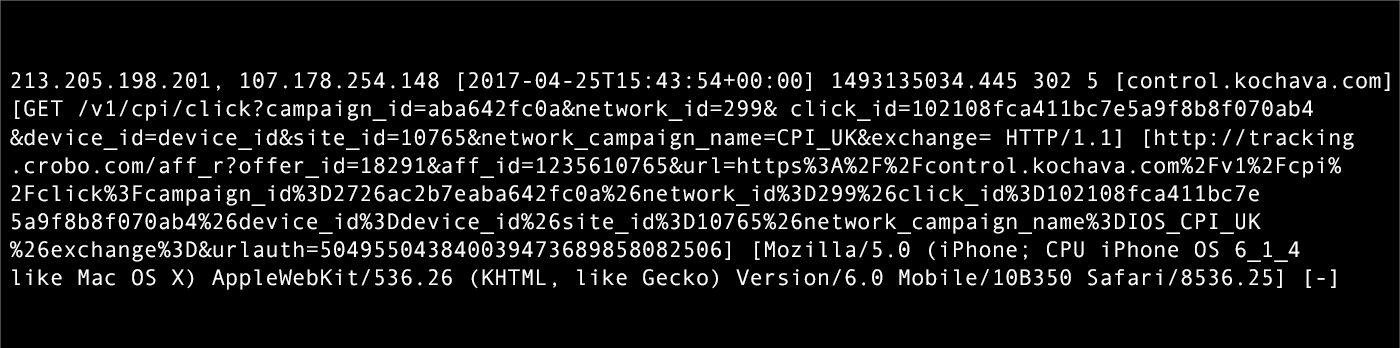
Now, I could write a parser to look through that log-level data, join it back to an internal user ID, and set up an ETL pipeline to ensure this data is in a data warehouse or feeds an internal service. But, the offensive part? You can’t analyze it. You can’t ask it questions. How log-level data is stored and made available is key to proving its value. As noted above, we’ve made row-level data directly actionable and attainable for our customers. Check out how much more useful structured, row-level data is.
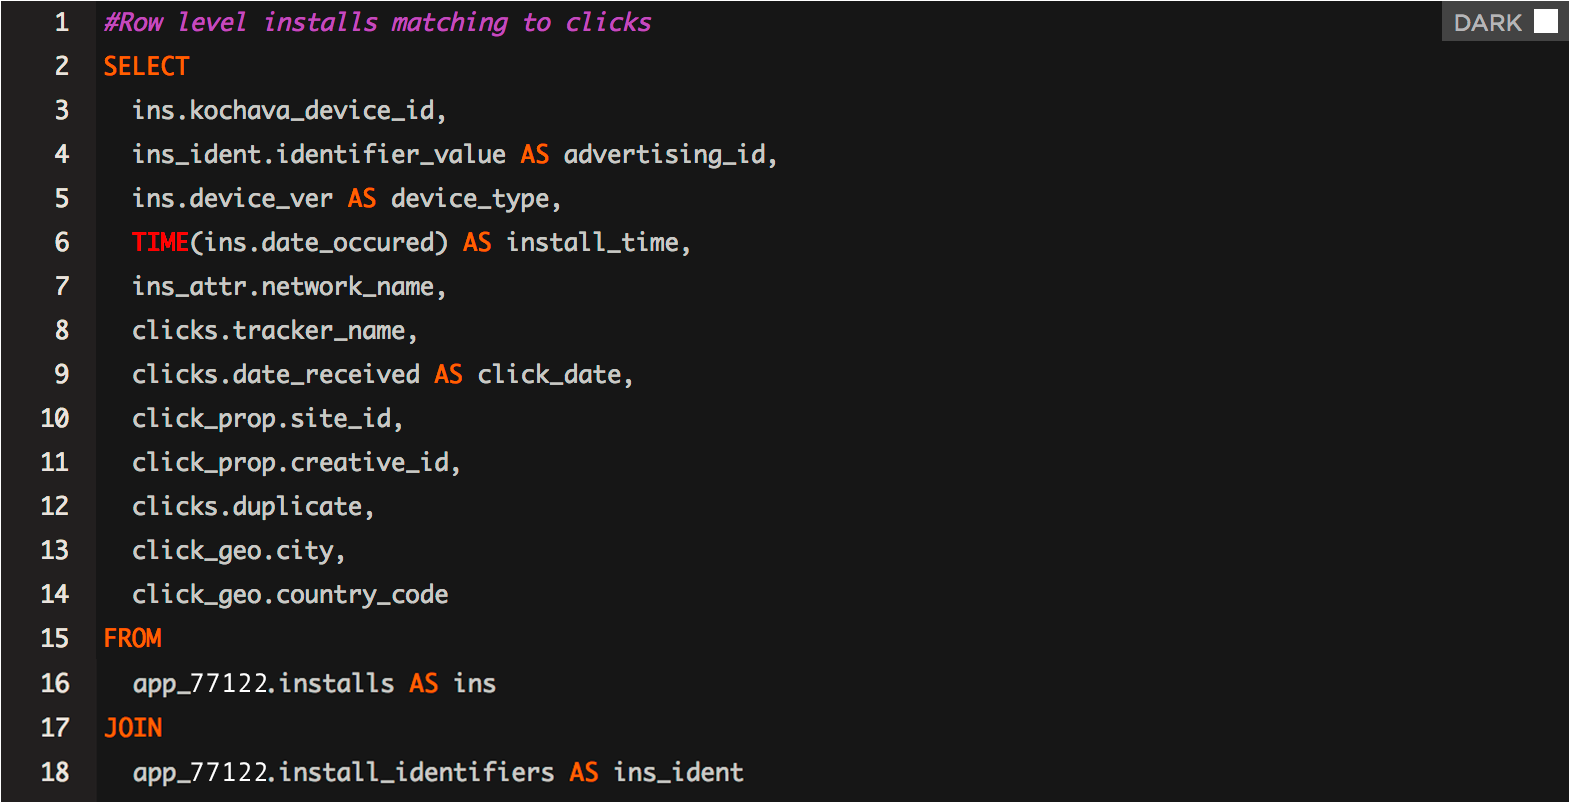
A critical difference for marketers between actionable row-level and log-level data is install deduplication over large periods of time. We use key indicators (primarily device IDs but also custom persistent Kochava IDs) to prevent a device that may be unaware that it’s already reported its install (e.g., reinstall or device restore) from reporting and creating another install profile. If this data is aggregated, we lose this ability to lookup over days, months, years, really for all time, which devices have installed and which identifiers were present on that first install to create a history of a device/user transitioning among devices, restores, and reinstalls.
To simply understand if a device or user has installed an application doesn’t, in all scenarios, require a full lookup of device history. But, populating caches like Redis or Memcache with billions of devices requires a historical store that is used to repopulate after an update or cache bust.
In the end, we at Kochava live and breathe data. We think in row level, we dream in real time. The ability to peer inside of a data feed, look past the noise, and ask that data questions is incredibly powerful, if the right tools are used.
See why we're the bestAbout the Author
 Eric Mann is the Director of Product Engineering at Kochava where he spends his days both hands-on with the codebase, as well as alongside fellow developers to architect, build, and sustain Kochava products and services. In addition to his role inside of Product/Development, Eric enjoys working directly with clients on implementations of the Kochava platform.